How Many Traders Actually Pass Prop Firm Challenges?

Christian Preciado
Co-founder & Lead Researcher at PropFirmsCompare
Christian is the co‑founder and lead researcher at PropFirmsCompare, specialising in prop firm evaluations, trading rules, and payout reliability. With hands‑on experience at Glencore in institutional commodity trading, he brings real‑market insight to every review. He has personally tested dozens of prop firms, focusing on transparency, trader‑first policies, and long‑term funding success
View full bio →Claims about prop firm challenge pass rates are everywhere. You will see figures suggesting that 5%, 10% or 20% of traders pass, but most of those numbers are repeated without a defined sample, date or source.
The honest answer is that there is no independently audited pass rate covering the entire retail prop firm industry.
The strongest current public benchmark we found comes from Topstep. Its 2025 disclosure states that 16.8% of all Trading Combines initiated were successfully completed. However, 51.8% of individual participants who made one or more attempts advanced to the funded level at least once. Among participants who reached the funded level, 33.3% received a payout.[1]
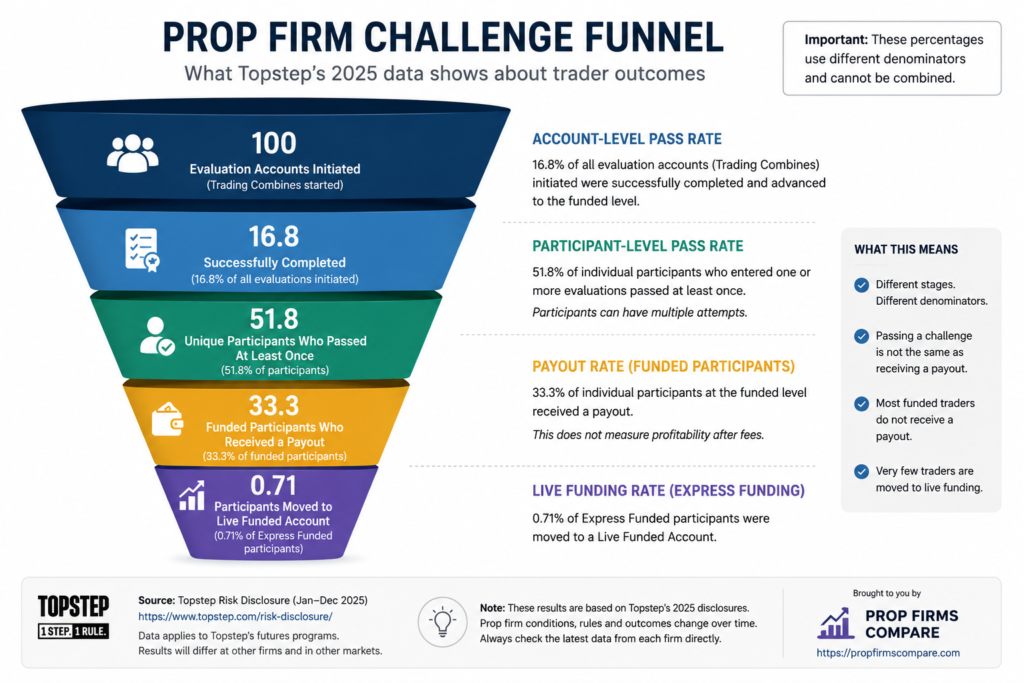
Quick answer: a reasonable evidence-based benchmark is that roughly one in six individual evaluation accounts may pass at a transparent provider, but that is not a universal prop firm pass rate. The percentage of people who eventually pass can be much higher when repeat attempts are included, while the percentage who receive a payout is lower than the percentage who reach a funded account.
This study separates account pass rates, trader pass rates, payout rates and live-funding rates. It also includes our own simulation of how win rate, reward-to-risk ratio and risk per trade can change the probability of completing a two-phase challenge.
In this study
- Key findings
- Published prop firm pass-rate data
- Why different pass rates conflict
- Our challenge-probability simulation
- How risk per trade changes the result
- Why most challenge attempts fail
- How many funded traders receive payouts?
- What prop firms should disclose
- How traders can improve their odds
- Sources and methodology
Key Findings
- There is no audited industry-wide figure showing what percentage of all prop firm traders pass.
- Topstep reports that 16.8% of Trading Combines initiated in 2025 were successfully completed.
- Topstep also reports that 51.8% of individual participants passed at least once after entering one or more Trading Combines.
- Among Topstep participants who reached the funded level, 33.3% received a payout in 2025.
- Only 0.71% of participants trading an Express Funded Account were moved to a Live Funded Account.
- The account-level and trader-level pass rates differ because one trader can purchase or start multiple evaluations.
- Passing an evaluation, reaching a funded stage, receiving a payout and becoming consistently profitable are four different outcomes.
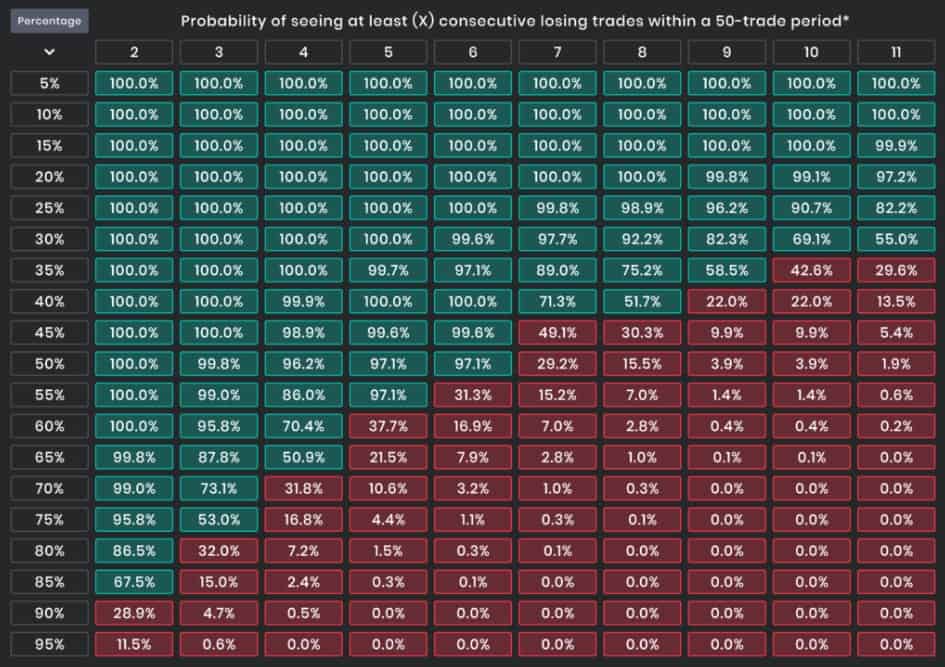
- Our simulation found that small changes in win rate can create large changes in two-phase challenge success when the target must be reached within a limited number of trades.
- Increasing risk can improve the chance of reaching a target quickly, but it also sharply increases the probability of breaching the account.
What Published Data Tells Us About Prop Firm Pass Rates
Most large retail prop firms publish testimonials, payout certificates and total payout figures. Far fewer publish the denominator required to calculate a meaningful success rate.
For example, a firm may announce that it paid 50,000 traders, but that number is difficult to interpret unless it also reveals:
- how many people purchased an evaluation;
- how many evaluation accounts were started;
- how many accounts were resets or repeat attempts;
- how many unique people reached the funded stage;
- and how many funded participants requested or received a payout.
Topstep’s 2025 performance statistics
Topstep is currently one of the clearer examples because it publishes several distinct measures in its risk disclosure.
| 2025 Topstep measure | Reported result | What it measures |
|---|---|---|
| Trading Combines successfully completed | 16.8% | Percentage of all initiated evaluation accounts that advanced to the funded level |
| Participants advancing at least once | 51.8% | Percentage of individuals who entered one or more evaluations and passed at least one |
| Funded participants receiving a payout | 33.3% | Percentage of participants at the funded level who received a payout |
| Express Funded participants called to live | 0.71% | Percentage of Express Funded participants moved to a Live Funded Account |
These figures apply to Topstep’s futures programme. They should not be presented as the average for forex, CFD, crypto or other futures prop firms. Different firms use different targets, drawdown rules, account prices, permitted strategies and definitions of funding.
Why 16.8% and 51.8% are both possible
At first, the figures appear contradictory. How can only 16.8% of evaluations pass while more than half of participants pass at least once?
The likely explanation is repeat attempts.
Imagine that one trader starts five evaluations and passes the fifth. From an account perspective, one of five evaluations passed: a 20% account pass rate. From a participant perspective, the trader eventually passed: a 100% participant success rate.
This distinction matters commercially because a trader may eventually reach the funded level while paying for several attempts first.
What was reported for 2024?
Business Insider reported that Topstep’s website showed a 12.4% funding rate for 2024 and that 28.3% of funded traders received a payout. The publication also reported that FTMO did not disclose comparable trading statistics and that Apex Trader Funding declined to provide its trader results.[2]
The 2024 and 2025 numbers should not automatically be treated as a clean year-on-year trend because wording, programme structure and denominators may differ. The more defensible use is as evidence that challenge completion and payout rates are materially lower than marketing success stories may suggest.
“Pass Rate” Can Mean Five Different Things
Any article claiming that a specific percentage of traders pass should define what is being counted.
1. Evaluation-account pass rate
This divides successfully completed evaluations by all evaluation accounts started.
It counts each repeat attempt separately. A trader who fails four accounts and passes one contributes five attempts and one pass.
2. Unique-trader pass rate
This asks how many individual people eventually passed at least once.
It usually produces a higher result because a trader may try repeatedly until one account passes.
3. Funded-account survival rate
This measures how many people keep a funded account for a specified period, such as 30, 90 or 180 days.
Passing an evaluation says little about long-term account survival when the trader changes risk or behaviour after qualifying.
4. Payout rate
This measures the percentage of funded traders who receive at least one payout.
It is more commercially meaningful than the challenge pass rate, but it still does not reveal whether the payout exceeded the trader’s total challenge, reset and subscription costs.
5. Sustained-profitability rate
This would measure traders who remain profitable after fees across an extended period.
Very few firms publish enough information to calculate this accurately.
Important: do not multiply Topstep’s 16.8% account pass rate by its 33.3% funded-participant payout rate and claim that 5.6% of evaluations produced payouts. The two percentages use different denominators and cannot be combined safely.
Prop Firms Compare Challenge Simulation
Because cross-firm public data is limited, we modelled a fictional two-step prop firm challenge to show how trading statistics can affect the probability of reaching the target.
This is not an estimate of the industry’s actual pass rate. It is a controlled scenario analysis designed to show how challenge difficulty changes when one variable changes.
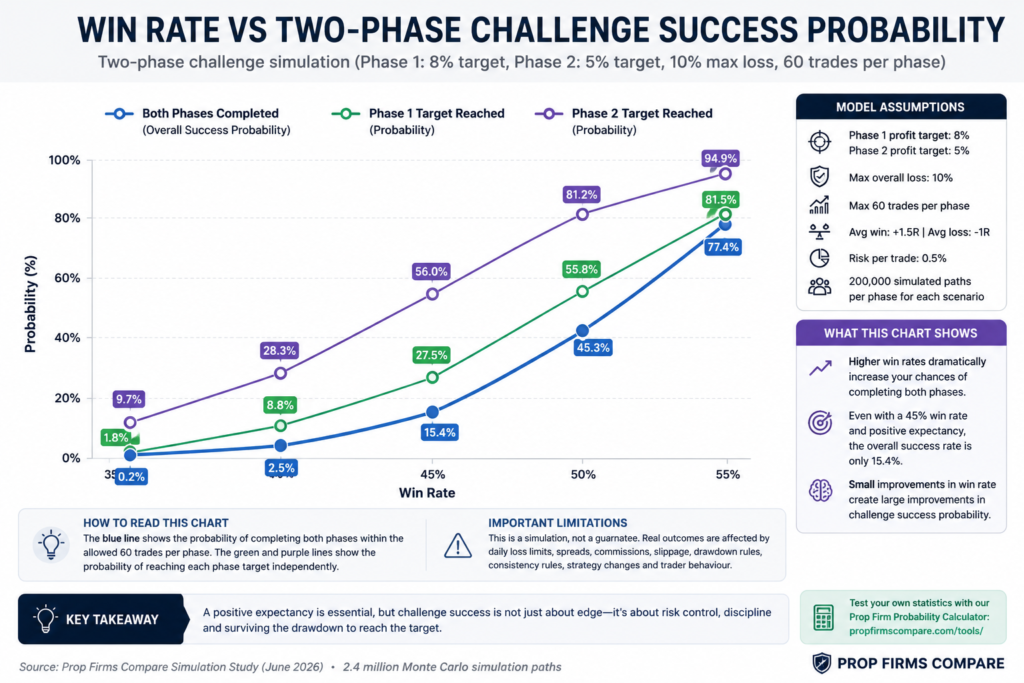
Simulation assumptions
- Phase-one profit target: 8%
- Phase-two profit target: 5%
- Maximum overall loss: 10%
- Risk per trade: 0.5% in the win-rate analysis
- Average winning trade: +1.5R
- Average losing trade: −1R
- Maximum of 60 trades per phase
- 200,000 simulated paths per phase for each scenario
- Combined probability assumes statistically independent phase outcomes
We excluded daily drawdown, consistency rules, spreads, commissions, slippage, correlated positions and behavioural changes. Real challenge outcomes could therefore be worse than the model.
Estimated probability by win rate
| Win rate | Strategy expectancy | Phase-one target reached | Phase-two target reached | Both phases completed |
|---|---|---|---|---|
| 35% | −0.125R per trade | 1.8% | 9.7% | 0.2% |
| 40% | 0R per trade | 8.8% | 28.3% | 2.5% |
| 45% | +0.125R per trade | 27.5% | 56.0% | 15.4% |
| 50% | +0.25R per trade | 55.8% | 81.2% | 45.3% |
| 55% | +0.375R per trade | 81.5% | 94.9% | 77.4% |
The model demonstrates why a small apparent edge may not be enough to pass quickly.
A strategy with a 45% win rate and 1:1.5 realised reward-to-risk ratio has positive expectancy. Even so, it completed both phases within the modelled 60 trades per phase in only 15.4% of simulated paths.
At a 40% win rate and 1:1.5 reward-to-risk ratio, the strategy is approximately break-even before trading costs. Its simulated probability of completing both phases was only 2.5%.
The result also shows why traders should use realised statistics rather than planned statistics. A strategy described as “1:2” may produce a much lower average winner if profitable trades are regularly closed early.
You can test your own statistics using the Prop Firm Probability Calculator.
How Risk per Trade Changes Challenge Success
We ran a second simulation while holding the win rate at 45% and average winner at 1.5R. We changed only the percentage risked on each trade.
| Risk per trade | Phase-one pass rate | Phase-one breach rate | Both phases completed |
|---|---|---|---|
| 0.25% | 0.9% | 0.0% | 0.1% |
| 0.50% | 27.6% | 0.5% | 15.4% |
| 0.75% | 50.5% | 3.8% | 35.8% |
| 1.00% | 64.9% | 10.3% | 51.9% |
| 1.50% | 73.9% | 19.7% | 60.2% |
| 2.00% | 71.8% | 27.6% | 55.8% |
This does not mean that 1.5% is the ideal risk per trade.
The fixed 60-trade horizon rewards strategies that reach the target quickly. As risk rises, the target requires fewer R-multiples, but the account also has less room to absorb losses.
At 0.5% risk, only 0.5% of the phase-one simulations breached the overall loss floor. At 2% risk, the breach rate increased to 27.6%.
Real accounts may fail even earlier because of daily drawdown, open-equity calculations and simultaneous positions. Traders should calculate the combined risk across all open trades rather than considering each position independently.
Use the position size calculator to convert your chosen account risk into an appropriate trade size.
Why So Many Prop Firm Challenge Attempts Fail
The trader does not have a measured edge
A challenge adds targets and loss limits to an activity in which most retail participants already struggle.
A 2017 academic paper examining Taiwan Stock Exchange data from 1992 to 2006 found that the aggregate net performance of day traders was negative in every year studied. The researchers described the vast majority as unprofitable and cited related research finding that fewer than 1% of day traders predictably earned profits.[3]
This is not a prop firm pass-rate study, but it provides useful context: an evaluation does not create a profitable strategy.
SEBI research reported that 91.1% of individual equity-derivatives traders lost money in India during the 2024 financial year. Across the three-year study period, only 7.2% made a profit.[4]
Again, this is market-profitability data rather than prop firm challenge data. It should not be presented as a direct pass rate.
The account size disguises the real risk budget
A £100,000 challenge account may allow only £10,000 of maximum loss and considerably less daily loss.
The relevant figure is not the advertised account size. It is the distance between current equity and the applicable breach level.
The challenge is path-dependent
Two traders can finish 100 trades with identical statistics but experience different short-term sequences.
One may begin with a profitable run and create a drawdown buffer. The other may experience six losses before the edge has time to emerge.
Risk increases under target pressure
Traders often use a controlled strategy on demo accounts and then increase risk during a paid challenge because progress feels too slow.
This changes the strategy being evaluated and reduces the number of losses the account can survive.
Several positions represent one market bet
EUR/USD, GBP/USD and gold positions may all depend on a similar US-dollar move. Three trades risking 0.5% can behave like one concentrated 1.5% position.
Rules end accounts that are still statistically recoverable
A personal account can continue after a drawdown if sufficient capital remains. A prop account ends as soon as a contractual breach level is reached, even when the strategy might later recover.
Our challenge-passing guide explains how to create personal risk limits below the firm’s official boundaries.
How Many Funded Traders Actually Receive a Payout?
Public payout-rate data is even more limited than evaluation pass-rate data.
Topstep’s 2025 disclosure states that 33.3% of individual participants at the funded level received a payout.[1]
That means reaching a funded account did not automatically lead to a payment for two-thirds of the funded participants measured during the period.
Possible reasons include:
- breaching the funded account before satisfying payout conditions;
- failing to generate sufficient qualifying profit;
- not completing required trading days;
- breaking consistency or conduct rules;
- or reaching the funded stage late in the measurement period.
The disclosure does not mean that the remaining participants necessarily lost money or acted improperly. It only means they were not recorded as having received a payout within the reported period.
A payout rate also does not show net trader profitability. A trader could receive one payout but still have spent more on evaluations, resets and subscriptions than they withdrew.
What Prop Firms Should Publish
Reliable comparisons would be easier if firms published the same statistics using standard definitions.
At minimum, an annual disclosure should include:
- total evaluations started;
- number of unique participants;
- number and percentage of accounts passing each phase;
- number of repeat attempts and resets;
- number of unique traders reaching the funded stage;
- funded-account survival after 30, 90 and 180 days;
- number and percentage receiving at least one payout;
- median and average payout;
- percentage recovering more than their total programme fees;
- and percentage transferred to live capital.
Firms should also explain whether “funded” accounts are simulated, live or part of a hybrid risk-management model.
Until comparable disclosures become standard, rankings based solely on testimonials or total payout announcements should be treated cautiously.
How Traders Can Improve Their Probability of Passing
No checklist can guarantee a pass, but traders can avoid making an already difficult evaluation unnecessarily harder.
- Use real statistics. Base the plan on your realised win rate, average winner, average loss and historical drawdown.
- Choose rules that fit your strategy. Compare static versus trailing drawdown, news restrictions, holding rules and funded-stage conditions.
- Set risk from the loss limit. Work backwards from the drawdown rather than forwards from the profit target.
- Use a personal daily stop. Stop below the official limit to preserve a buffer for floating losses, costs and slippage.
- Limit correlated exposure. Measure total account risk across all positions.
- Do not impose an artificial deadline. Target pressure can lead to low-quality trades and excessive position sizes.
- Review the funded stage before buying. Passing has limited value when the payout or funded-account rules do not suit you.
Compare the Rules Before Starting a Challenge
Use our comparison tool to examine selected prop firms and then read the full review before paying an evaluation fee.
Compare Prop Firms View the Best Prop Firms
New traders can also review our prop firms for beginners, while detailed provider research is available in the prop firm review directory.
Sources and Methodology
Published firm statistics
[1] Topstep, “Risk Disclosure”, updated September 2025. The disclosure reports performance from January to December 2025.
[2] Business Insider, “Inside the $12 Billion Prop Trading Industry That Has Gen Z and Millennial Investors Hooked”, published December 2025.
External trading-performance research
[3] Barber, Lee, Liu, Odean and Zhang, “Do Day Traders Rationally Learn About Their Ability?”, October 2017. The paper analyses Taiwan Stock Exchange data from 1992 to 2006.
[4] Securities and Exchange Board of India study of individual equity-derivatives traders, reported September 2024.
Prop Firms Compare simulation
[5] Prop Firms Compare original Monte Carlo analysis, June 2026.
Each scenario used 200,000 simulated trade paths per phase. A win added 1.5R and a loss deducted 1R. A path passed when it reached the phase target, failed when it reached the maximum loss, or was marked incomplete when neither boundary was reached within 60 trades.
The combined two-phase figure multiplies the separately estimated phase-one and phase-two probabilities. It assumes independent phase outcomes and identical trading statistics in both phases.
The model excludes daily-loss limits, consistency rules, spreads, commission, slippage, changing trade sizes, correlation, market regime changes and behavioural errors. Results are illustrative and are not forecasts of individual performance.
References
- Topstep Risk Disclosure: Topstep’s current disclosure reports the 16.8% account completion rate, 51.8% participant-level progression rate, 33.3% funded-participant payout rate and 0.71% live-account progression rate.
- Business Insider industry report: This reports Topstep’s 2024 figures and notes the lack of comparable disclosures from FTMO and Apex Trader Funding.
- Barber et al. academic study: The paper uses complete Taiwan Stock Exchange transaction data, finds negative aggregate net performance in every year studied and discusses the small proportion of predictably profitable day traders.
- SEBI retail derivatives study: Reuters reports that 91.1% of individual traders lost money in FY2024 and only 7.2% were profitable over the three-year study period.
How to Cite This Study
Prop Firms Compare (2026), “How Many Traders Actually Pass Prop Firm Challenges?”, PropFirmsCompare.com. Accessed 25/06/2026.
Researchers, journalists and publishers may quote the findings with attribution and a link to this page. Please contact us for the underlying simulation table or additional methodology details.
Prop Firm Pass Rate FAQs
There is no audited industry-wide percentage. Topstep reported that 16.8% of all Trading Combines initiated during 2025 were completed successfully. This is a useful public benchmark but should not be applied automatically to other firms or markets.
The claim is plausible for some programmes or account-level samples, but there is no comprehensive evidence proving that exactly 90% of all prop firm traders fail. Any percentage should include its firm, period, denominator and definition of passing.
Topstep reported that 51.8% of individual participants who entered one or more Trading Combines in 2025 advanced to the funded level at least once. This is higher than the account pass rate because participants can make multiple attempts.
Topstep reported that 33.3% of individual participants at its funded level received a payout in 2025. Comparable current data is not publicly available from many other large firms.
No. Passing shows that the trader met the evaluation conditions during one sequence of trades. It does not guarantee long-term profitability, funded-account survival or repeated payouts.
More attempts create more opportunities to pass, but they also increase the total amount spent. A trader should correct the cause of failure rather than repeatedly purchasing identical evaluations with the same strategy and risk.
The combination of a positive trading expectancy and risk low enough to survive normal losing sequences is more important than win rate alone. Challenge rules and trader behaviour also materially affect the result.
No firm is universally easiest. Suitability depends on the profit target, drawdown method, time conditions, permitted strategy and the trader’s own statistics. Use the prop firm comparison tool rather than relying on an “easy challenge” label.
Last updated: June 2026. This article is provided for education and research. It does not predict individual results or constitute financial advice.
Prop firm rules and account programmes can change. Verify current conditions before purchasing an evaluation.
Some internal links lead to commercial pages containing affiliate links. Prop Firms Compare may earn a commission when a purchase is completed, at no additional cost to the reader.